The Juggo dashboard provides a very high level of detail and length in the data it displays. Always according to the fields and parameterization decided by the user. This is one of the great advantages of this data reconciliation tool. It allows you to have in seconds an impressive amount and quality of information relevant to the company, organization or entity.
Reconciling data with Juggo.
Juggo can perform different types of management, crossing and reconciliation of data.
Reconciling the data from two systems according to the crossing rules decided by the user, even if they have a huge size, is one of the things that this revolutionary technological tool does. Also if the files to be reconciled are in different formats or languages, accessing their meta data to avoid errors due to changes in ways of displaying the data according to regions.
And in the Juggo dashboard, integrated in PowerBI, you can see the summary of the reconciliation in the period you want. It can be on a certain day, for example. Or in a week or a month. Even in one-hour time slots or in real time. There are several options for you to choose the right one at any time to get the information you need.
This is shown in a very visual and easy to understand summary. In addition, in different steps you can cross data by a certain field to see it in more detail.
The result of the reconciliation is not seen only in numbers. You can also see it in a very visual and easy to analyze graph. Then, accessing the Juggo dashboard you have access to the results at different levels of detail, a very valuable information.
Juggo Dashboard, levels of detail and length of data provided.
The Juggo dashboard provides real-time data from the reconciliation. Both numerically and graphically for each of them. The level of detail and filtering capacity that this technological tool allows is very high. But it is the user who decides in which level he wants to stay or which one interests him, if a simpler level or if he wants to know the data obtained by Juggo to the minimum detail. That’s why Juggo always shows you the data of your interest, because it does it according to your own parameters.

Use Juggo as your bank reconciliation software
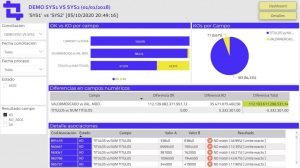
First level of detail of the Juggo dashboard.
In the first step of the dashboard you can see:
- Number of records in the system.
- Associated records according to the system rule.
- Non associated records according to the rule defined by the system, both in their number and detailing what they are.
- Volume of cross data.
- Discarded from the system if any.
- Duplicates if any.
If you want to change the reconciliation, you will instantly get the data of one or the other in the Juggo dashboard. Again, both numerically and through color graphics. And also the percentages of the crossing processes.
It also allows you to see:
- How many times has Juggo been asked for the same reconciliation. Very practical, for example, to check if after an adjustment or change in any file has been re-scanned. It even indicates the time at which it has been performed.
- Summation of values if desired.

Juggo, a perfect software for logistical data reconciliation
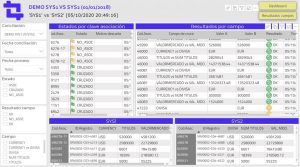
Second level of detail.
The Juggo dashboard allows for more levels of detail on different screens. The second allows access to levels of detail that indicate issues such as:
- The crossover ratio per field.
- The differences in number fields.
- The association detail by reference and values of each system with the crossed fields. And with a visual indicator in the form of a colored icon of the result thrown and whether or not all the fields in each of them have been crossed.
- What data has not been crossed and what is the non-matching field as well as the deviation that prevented the crossing of this data.

Juggo, your solution for the reconciliation of medical data
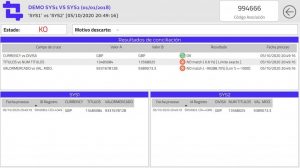
Third screen of details of the Juggo dashboard.
It yields detailed results by association key as well as by field. You can also see how the data from both files or reconciled systems came in raw. With an impressive capacity and instantly.
In addition, you can click on each one to see in detail the association sheet with a series of concise, clear and detailed data that gives you more valuable information about it.
Export report from the dashboard.
And how can you start working with the information provided by the Juggo dashboard? Download an Excel with a single button from the Juggo dashboard that allows you to go down to the maximum level of detail. And thus be able to make decisions at the registry level that Juggo has used in the reconciliation process.
This Excel document has several tabs where you can see all the records according to whether it has reconciled, discarded, those who have associated and those who have not associated, as well as duplicates according to a given parameter in one system and in the other.
In the main screen of this report, the associates screen, shows details such as association codes, crossing field values and the result of the crossing in each field. The amount, detail and value of the information allows to work on it easily and attending to the issues that interest each user.
Higher levels of detail.
If you are looking for even more detailed data you can go back to the first dashboard summary screen. And there access a particular record to see how the records came in the original files.
This way you can check that Juggo doesn’t alter any data, keeps the information provided and shows the real crossover of the original data. Something that gives you the security you need and demonstrates the reliability of the system. And it allows to see both the crossed fields and the original data so that each user can decide how to use them according to their interests.
The Juggo dashboard is easy to use, visual and intuitive. To learn how to use it very quickly. And it allows you to obtain results from the data at different levels of detail and according to the parameters that you as a user decide. Immediately, numerically and by means of color graphics. We invite you to learn more about Juggo, how it can help your business, organization or entity and how to use it. Contact us, we are happy to assist you.


